The ocean has been around for billions of years. Yet, we only started measuring oceanographic variables in the late eighteenth century. We’ve got a long way to go before we can fully understand it.
What we do know is that it’s changing at a rapid pace—and at the crux of many of these changes is our warming global sea surface temperature.
To get you up to speed, this post is an introduction to sea surface temperature, and we’ll be answering all the fundamental questions:
What is it?
How is it measured?
What is the data telling us?
And most importantly, why is this information important?
What is sea surface temperature (SST)?
Sea surface temperature (SST) is the water temperature close to the ocean’s surface. It varies mainly with latitude, with the warmest waters generally near the equator and the coldest waters in the Arctic and Antarctic regions.
As the oceans absorb more heat, sea surface temperature increases, and the ocean circulation patterns that transport warm and cold water around the globe change.
How is SST measured?
SST was one of the first oceanographic variables measured, yet it is still a fairly new phenomenon. The first recording was in the late eighteenth century by Benjamin Franklin, who suspended a mercury thermometer from a ship while traveling between the US and Europe. SST was later measured by dipping a thermometer into a bucket of water that was manually drawn from the sea surface (yes, humble beginnings).
The first automated technique was accomplished by measuring the temperature of water in the intake port of large ships in 1963.
Today, SST measurement is obtained by satellite microwave radiometers, infrared (IR) radiometers, in situ moored and drifting buoys, and ships of opportunity. Different instruments measure the temperature at different depths. For instance, most buoys have sensors located at about 1-meter depth or placed at regular intervals along a tether line. When measured from space, sea surface temperatures represent a depth that is related to the frequency of the satellite instrument. For example, IR instruments measure a depth of about 20 micrometers, while microwave radiometers only measure a few millimeters.
Satellite infrared data is merged with the temperature data drawn from ships and buoys to create a holistic understanding of sea surface temperature at a larger scale. We’ve come a long way from the bucket method.
Why does SST data matter?
While heat energy is stored and mixed throughout the depth of the ocean, the temperature of the water right at the sea’s surface—where the ocean is in direct contact with the atmosphere—plays a significant role in weather and short-term climate. The ability to measure it allows us to observe the global system and quantify ongoing weather and climate change.
What is Sea Surface Temperature data telling us?

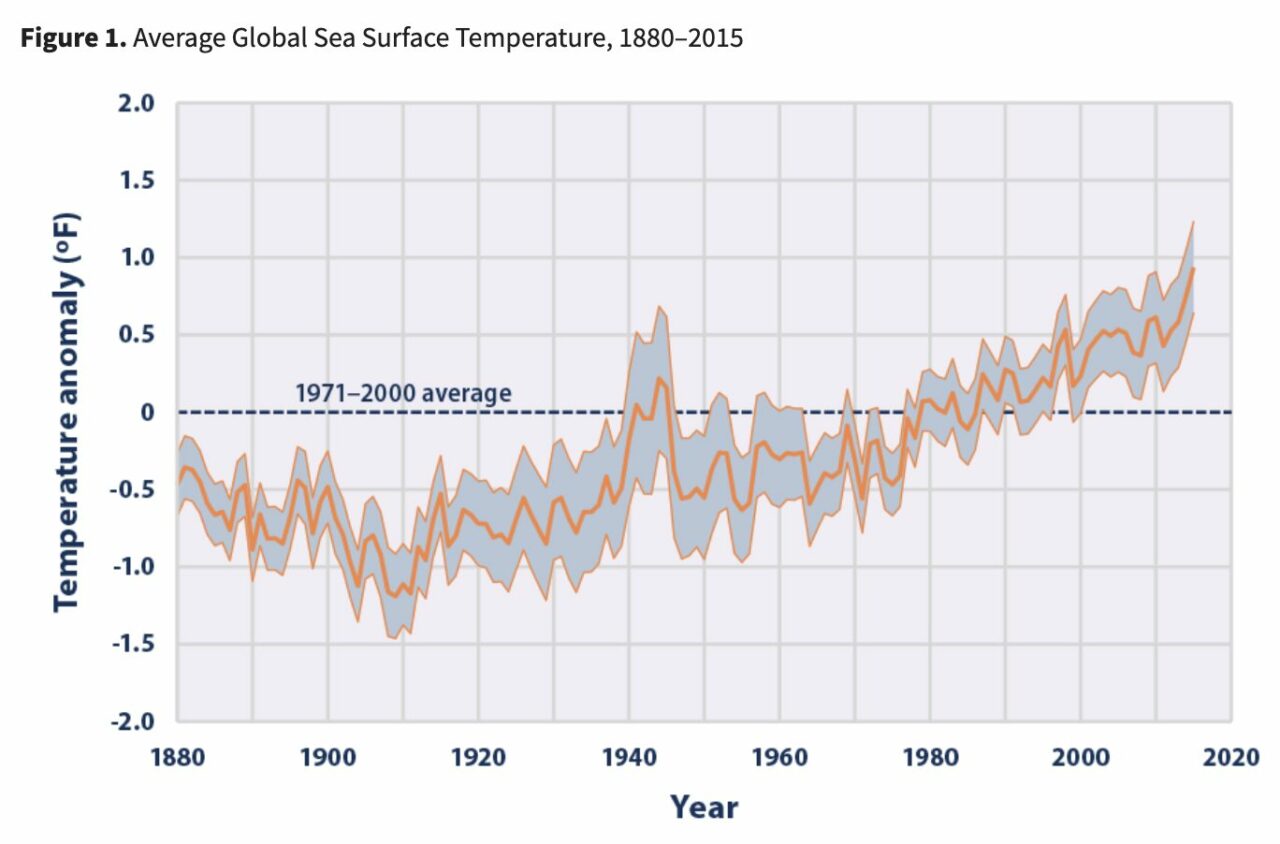
Source: EPA.gov
Due to global warming, the average global SST is on a steady incline. From 1901 through 2015, the temperature rose at an average rate of 0.13°F per decade. It doesn’t sound like a lot, but it’s severely impacting the ocean; sea levels are rising, and ocean circulation patterns are changing—disrupting marine ecosystems and even human livelihood.
Why should we care about rising sea levels?
As the water warms, two things happen. First, it expands as its temperature increases. Second, it melts glaciers and ice sheets. Together, these phenomena increase sea surface temperatures, and consequently, sea levels.
Rising sea levels lead to greater coastal erosion, stripping the coast of its natural protection consisting of sediment and wetlands. Each year, extreme weather events—such as cyclones, storm surges, and hurricanes—increase in intensity and frequency. Due to coastal erosion, communities are at greater risk of floods, and ultimately habitat and infrastructure destruction.
We can’t stop rising sea levels, but we reduce their impact. Learn how improved ocean data can help coastal communities mitigate the risks associated with rising sea levels.
How does SST change ocean circulation patterns?

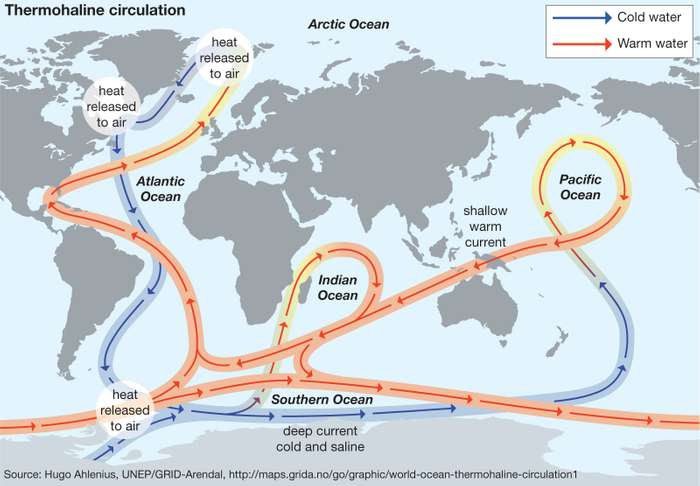
Source: Britannica.com
Ocean circulation is the large-scale movement of waters in the ocean basins. The oceans have thousands of currents, gyres, and eddies that carry water around the planet. Their movements regulate the Earth’s climate and transport carbon, heat, and nutrients.
Together, these currents act like a giant conveyor belt that transports heat from the tropics to the higher latitudes. As warm water from the tropics flows toward the poles in wind-driven currents near the surface, it cools, becoming denser and heavier, and eventually sinks. Temperature and salinity drive this circulation—so changes in these variables will affect it. Warming waters are melting ice sheets and glaciers. In conjunction with increased rainfall, ocean water is becoming less saline (and less dense than saltier water), which is slowing the ocean’s circulation.
A Nature study reveals that the Atlantic Ocean’s circulation has slowed by about 15 percent since the middle of the last century.
Which industries are being affected by increased SST?
Four industries that are especially impacted by increased SST are the maritime industry, offshore oil and gas industry, agricultural industry, and fishing industry.
The increase of extreme storms and other weather events along the coast can cause million and billion of dollars worth of damage to the maritime, offshore oil and gas, and agricultural industries’ assets and operations. The need for real-time data and warnings is incredibly important for monitoring and predicting the storms and their effects—to reduce damage and operation closures.
The slowing ocean circulation patterns create inhabitable marine ecosystems for some species, driving them to cooler water and subsequently affecting the local food chain. There is an increase in the frequency and density of harmful algal blooms such as red tide. Additionally, scientists link increased SST to coral bleaching, leading to a decline in fish populations. Fisheries located in areas of rapidly warming waters are seeing severe decreases in fish stock—some to the point of collapse. Obtaining denser data can identify areas that need critical rehabilitation and help guide sustainability projects.
The original article by Ayesha Renyard was originally published at sofarocean.com
About Sofarocean:
Our oceans cover over 70% of our planet’s surface, drive our climate system, and over 90% of the world’s trade is carried by sea. Our ocean environment affects us every day, through weather, the food we eat, and the stuff we use. Yet, ocean data is exceedingly sparse, and we know more about the surface of the moon than the waters surrounding us. Distributed sensing has revolutionized digitizing on land and from space. Ocean’s are next.
Our goal is to create a data-abundant ocean and provide critical insights into science, society, and industries. As a first step, we deploy and grow the world’s largest real-time ocean weather sensor network which provides the most accurate marine weather information and forecasts to power industry-specific solutions.
We believe that more and better ocean data will contribute to a greater understanding of our environment, better decisions, improved business outcomes, and ultimately contribute to a more sustainable planet.
Featured Image Credits: Pixabay


