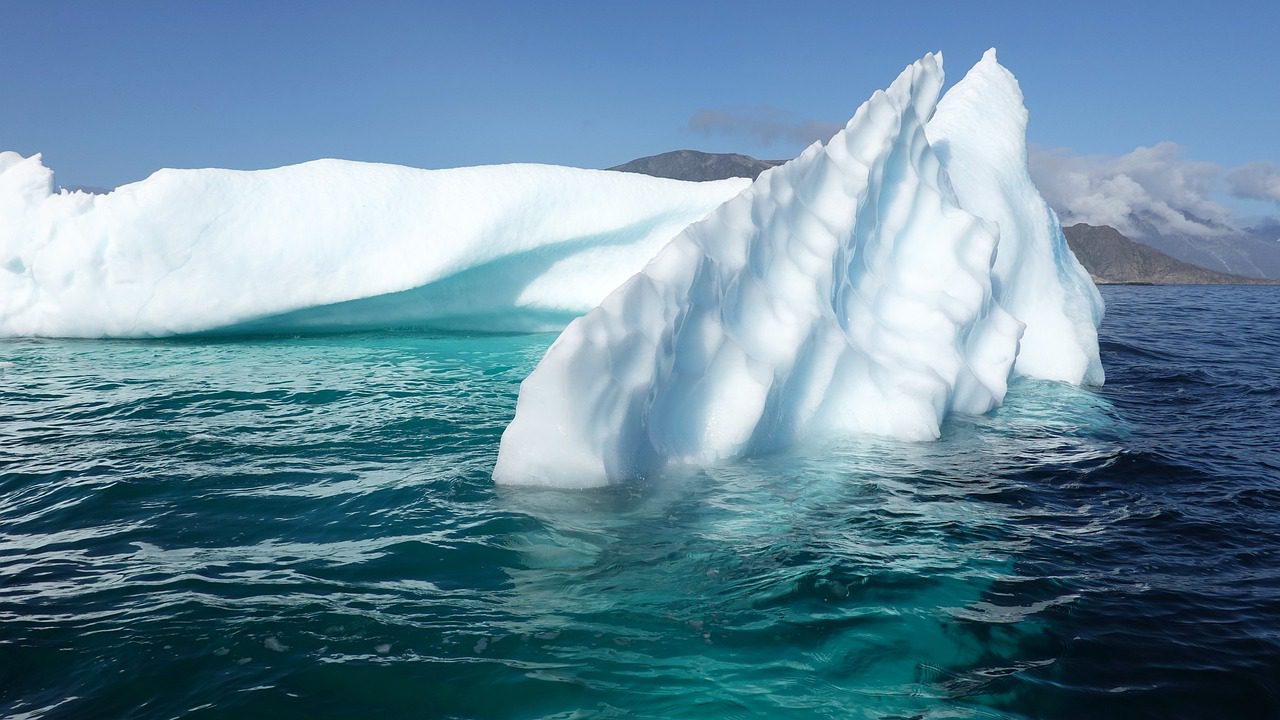
This year brought some bad news on the climate change front: researchers found that ice is melting faster worldwide, and there’s a greater sea-level rise anticipated. The rate of ice loss each year has increased by 60%. A study of the Greenland ice sheet found that...
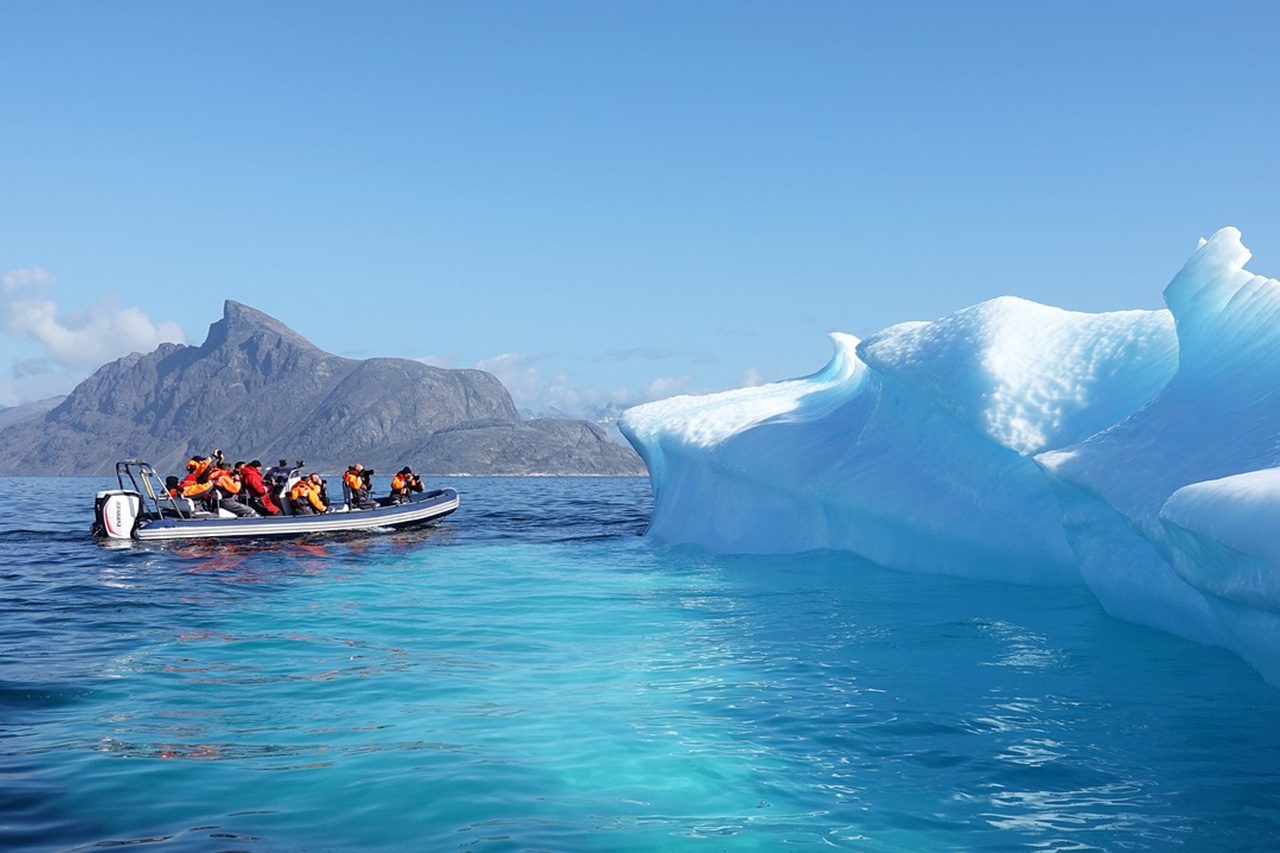
How Does Climate Change Affect the Ocean
Continue Reading